Statistics are very important for system and algorithmic traders. EA Analyzer Pro is a Forex trading analysis software that provides advanced test results for Expert Advisors and manual TSs. Of course, trading terminal advisers issue a detailed report and show a graph of trading efficiency, however, such Forex system testing programs as Ea Analyzer are able to display much more information that will help change the trader's approach to his system and keep temporary deposit drawdowns under control.
You can download the Forex program for free at the end of this review or on the developer's website. Before proceeding to the description of the program itself, you should load the results of trades of advisors or strategies into it. For convenience, you can use the trading.
All examples are on assembly 3.0.0, but there are updated versions today. You can also pay attention to Ea Analyzer in Russian, which has established itself as a reliable Forex program for trading and analytics. Of course, the forex program in Russian is somewhat different from the original, but in terms of functionality it is not inferior to it. You can download Ea Analyzer for free on the official website - versions with assembly 3.0.0 for 32 and 64-bit PC operating systems are provided. Also, EA Analyzer can be downloaded as a torrent.
Analyzer Program: Loading Data
First of all, you need to open the trading terminal and click on the "Strategy Tester" icon or type Ctrl+R. After that, an adviser window will appear at the bottom of the terminal, which should be configured at your discretion. Basic settings should be made in the following tabs:
- Expert Advisor (choice of advisor or indicator);
- Symbol (trading instrument);
- Model (recommended setting "All ticks");
- Date (setting the system testing period);
- Expert Advisor properties (a menu that allows you to change the deposit, lot size and other important parameters);
- Time period (timeframe).
After setting all the parameters, you should press the "Start" button, wait for the end of the test and go to the "Results" tab. Further, you can select the results of interest and save them in HTML format to any convenient folder.

It is also possible to save multiple reports by trying the EA with different settings or with other currency pairs.
Ea Analyzer: how to use
To load data, open the analyzer window and select the “Load” tab.

After clicking the icon, a window will appear in which you should select the results of interest and load them into the analyzer.

Analyzer interface
In order for a trader to be able to fully use this program, its interface should be described in detail.
Top Icons:
- Load - allows you to download strategy reports;
- Results in money - change in the display of the financial result (pips, interest, deposit);
- Our other products - a list of other developments of the company;
- Quant Editor - access to the editor, allows you to change the source code.
First of all, you should consider the displayed data from the trade:
- Select report by date;
- Total income;
- Earnings in pips;
- Average annual profit;
- Average profit as a percentage.
Designation of icons with detailed statistics:
- Number of orders;
- Sharpe ratio;
- Trade efficiency. (If the value is less than 1, trading is considered inefficient);
- The ratio of average earnings to losses;
- The ratio of profitable trades to total - it is desirable that the data show a value of more than 50%;
- drawdown;
- Drawdown in percent;
- Average daily profit;
- Average monthly income;
- Average profit per trade;
- The percentage of income to drawdown;
- Mathematical expectation - the smaller the number, the better;
- Mathematical expectation depending on the number of trades;
- Trade quality indicator;
- Trade rating indicator - you can change the number of trades, which will change the rating indicators.
By scrolling, you can see detailed statistics showing the following data:
- The number of profitable trades to unprofitable ones;
- The ratio of average profit to average loss;
- A measure of deviation from the mean;
- The number of days of stagnation - when trading did not make a profit;
- Percentage of stagnation - shows the effectiveness of trading;
- Distribution of profit and loss by months.
You also need to pay attention to other bookmarks of the program.
List Of Trades
This tab shows the parameters of completed transactions, and in particular:
- currency pair;
- Timeframe;
- Market order direction;
- Position opening time;
- Quote price at the time of position opening;
- Lot volume;
- Position exit time;
- Price at the time of closing the order;
Also in this column you can find information about the profitability of transactions in percentage terms, points and in monetary terms.

equity chart
This tab shows a graph of the effectiveness of a trading system or an adviser. The information is displayed as a broken line. In this chart, you can include several reports at once and analyze the effectiveness of several strategies at the same time. There are also deal settings that allow you to select positions exclusively for buying or selling.

trade analysis
Quite informative and useful bookmark for a trader. In it, you can see which hours were profitable or unprofitable in trading, as well as positive and negative days of the week.
By clicking on a small checkbox, you can analyze the histogram, which displays profit, profit ratio of short and long trades for the year, by day of the week, etc.

Settings
Advisor settings. In cases where a trader analyzes manual trading, only the initial deposit will be displayed in this window.

Monte Carlo
This tab allows you to check the trading system for stability. It is possible to swap orders or exclude some of them randomly within a certain percentage. After certain changes in the strategy, it is easier for the investor to choose the optimal settings for advisors or upgrade the mechanical trading system.

What if scenario
These settings allow you to exclude certain trading days from the strategy. You can also add restrictions in the form of opening buy or sell orders. It is worth noting that this function can serve as an excellent filter and allows you to identify inefficient trading in a given situation.

Summarizing
As you can see from the review, Ea Analyzer for Windows is a powerful tool that allows you to improve your trading skills, filter out unfavorable times for opening positions and choose an effective trading instrument with the maximum mathematical expectation.
Used in real money trading should be fully understood by the trader. But not always and not everyone understands the meaning of certain parameters of the system, and when it starts to cause losses, they cannot determine the reason for the change in its behavior. Since the market is volatile, from time to time any trading system also needs to be changed, adjusted to new conditions. For example, change the settings of indicators during a market stagnation, which was preceded by an active movement, time frame, or correct other points in order to resume profitable trading.
StrategyQuant has created a unique program of its kind EA Analyzer, designed to conduct a deep analysis of trading systems, both manual and automatic. The analysis is carried out on the basis of reports received in . On the official website of StrategyQuant you can download a demo version of the program, on the website the site presents a free, earlier version, which differs slightly, but you can use it for an unlimited time.
To use strategy tester EA Analyzer To analyze your trading systems, you need to understand the program, its interface, and functionality. This article will be devoted to this.
Features of the EA Analyzer program.
So, you can download the program from the following link:
Download ea-analyzer.rar (downloads: 745)
After downloading, the standard procedure for installing the program on a computer is carried out. The installed program looks like this (the image can be enlarged by clicking):
Rice. 1. Interface of the EA Analyzer program.The program menu contains 9 blocks, each of which has a specific function. Below we will go through all the tabs.
A distinctive feature of EA Analyzer is the implementation of a more detailed analysis of the results of the trading system compared to the standard capabilities of the MT4 trading terminal. It also allows you to make consolidated statements of Expert Advisors for several trading instruments, simultaneously combining the results of all Expert Advisors in one report. The report contains detailed statistical characteristics of trading, in particular, not available in the report received in the MetaTrader 4 terminal: monthly and annual profitability of the system, profit and loss charts, depending on the day of the week, hour of entering the market, the number of transactions by hour, the duration of transactions and other data in graphical form.
After the trading system is run in the MetaTrader 4 trading terminal, it must be saved in the .htm format. The file with the report is loaded into the program by pressing the Load button and selecting the file through the data upload form (the image is clickable):
 Rice. 2. Loading the Expert Advisor's report into the EA Analyzer program.
 Immediately after loading, an analysis of the system's operation on history is formed. Let's take a closer look at the values that are presented in the fields of the analyzer.
EA Analyzer functionality.
The first information block Overview provides information on indicators that describe the overall picture of the analysis results, in particular:
- - Total Profit - the total profitability of the system (in points, in percentage and in currency);
- - Profit in pips - total profit in points;
- - Yearly avg profit - average annual profitability. The indicator will be informative only if the trade was carried out all the time by one;
- - Yearlyavg % return - average annual return as a percentage of the deposit;
- - # of trades - total number of trades;
- - Sharpe ratio - statistical coefficient, secondary characteristic of the account;
- - Profitfactor - the main statistical indicator, a kind of profitability factor of the strategy. If the value is less than 1.6, the strategy is considered ineffective. If the value is greater than 3, the strategy can be classified as aggressive, and therefore dangerous;
- - Return/DDratio - ratio of average profit to drawdown. The lower the value, the more transactions are "overstayed". The higher the score, the better;
- - Winning percentage - the percentage of winning deals in relation to their total number;
- - Drawdown - absolute drawdown of the deposit according to the strategy;
- - % drawdown - absolute drawdown in percentage terms;
- - Daily avg profit and Monthly avg profit - average daily and monthly profitability. Can be expressed in currency, points or %;
- - Average trade - average trade. A negative value indicates the inefficiency of the system;
- - Annual %/MaxDD% - the percentage of profit from the initial deposit to the drawdown Everything is calculated as a percentage. Determines the effectiveness of the strategy;
- - R expectancy - mathematical expectation relative to the average risk;
- - Rexpectancyscore - the previous indicator is divided by the number of completed deals;
- - Strategy quality number - quality rating assigned by the strategy program based on statistical characteristics;
- - SQNscore - similar to the previous indicator, only tied to the number of transactions (enlarge the screen if necessary):
Below is the STATS block with its own set of parameters:
- - Wins/lossesratio - the ratio of trades closed with profit to losses;
- - Payoutratio (avgwin/loss) - ratio of average profit to average loss;
- - Average # barsintrade - the average number of bars in one trade, i.e. how many candles, on average, one trade is opened;
- - Z-score - determines the deviation from the average value of the result of the operation. If the value is positive, after a profitable trade, there is a losing trade, if the value is negative, after a profitable trade, there is a profitable trade again. The higher the index is greater than zero, the higher the probability of what was said;
- - Expectancy - an indicator that characterizes the expectation of the system and shows the average profitability of each transaction in the future;
- - Deviation - standard deviation from expected value. The lower the indicator, the better, the smoother the growth graph will be for the system;
- - Stagnation in days - stagnation in days, i.e. how many days the system works with income equal to zero;
- - Stagnationin - stagnation, expressed as a percentage of the total time of the strategy (the screen is clickable):
In the block below, you can see the already familiar characteristics that the report produces in the MT4 terminal. Unless the new indicators are Avg # ofbarsinlosses and Avg # ofbarsinwins , which express the average number of bars in loss and profit. even lower, a table is built with the distribution of profit / loss not only by months, but also by years. The next tab in the main menu is the List of Trades. This will display a table resembling a report from the MT4 platform that collects all trades sorted by date. The table consists of the following blocks:
- - Ticket - order ticket;
- - Symbol - symbol of the trading instrument;
- - Timeframe - chart time frame;
- - Type - order type;
- - Opentime - trade opening time;
- - Openprice - trade opening price;
- - Size - deal size in lots;
- - Closetime - order closing time;
- - Closeprice - order closing price;
- - Timeintrade - the time during which the transaction was in the market;
- - Cumulative P/L ;
- - P/L in money - the result of the transaction, expressed in currency;
- - Cumulative money P/L ;
- - P/L in pips - ratio of profit to loss in points;
- - Cumulativepips P/L ;
- - P/Lin % - ratio of profit to loss in percent;
- - Cumulative P/L % ;
- - Comment - comment to the order (the image is enlarged):
Clicking on the Manage view button brings up a window, the functionality of which allows you to change the view of this table and display only those parameters that are of interest to the trader. The third tab is Equity chart. A balance chart will be displayed here, and if a trader uploaded several reports within one portfolio, then all reports will be displayed. You can choose to display the chart only for sell or buy trades, enable or disable the highlighting of the period when stagnation was observed, the drawdown display method (display / not display, in monetary terms, in points or as a percentage). Checking the checkbox for drawlines responds to the construction of a trend line on the chart (the image can be enlarged):
 Rice. 6. View of the balance chart in the EA Analyzer program.
 Of particular interest is the Trade Analysis block. Here is a graph of yield by year. The functionality of the section allows you to select any of 20 types of charts to display the necessary statistical information (enlarge if necessary):
 Rice. 7. Graphs with statistical characteristics of the system.
 You can display information on the screen in graphical form on such indicators as:
- - Tradesbyhour/weekday/day/month/year - number of trades by hour/day of the week/day of the month/month of the year/year;
- - Tradesbyduration - transactions by the duration of their stay on the market;
- - P/Lbyhour/weekday/day/month/tradeduration - profit/loss by hours/days of the week/days of the month/months/duration;
- - Longvsshorttrades - ratio of buy trades to sell trades;
- - Longsvsshorts P/L - the ratio of profit factors of buy deals to sell deals;
- - Profit/loss - ratio of profit to loss;
- - Longprofit/loss and Shortprofit/loss - ratio of total profit to loss only for buy trades or only for sell trades;
- - Wins/lossesbyhour, day, weekday, month - profitable and losing trades by hours, days, months;
- - Wins/lossesprofitbyhour, day, weekday, month - profit and loss in currency also depending on the period.
The final report can contain 6 different graphs.
The next section is Settings. The settings of the Expert Advisor will be displayed here, if the report of the work of an automatic Expert Advisor has been loaded into the program. If the program analyzes a manual strategy, then only the initial deposit will be displayed. When setting a custom initial deposit in the Initialdeposit field, you will need to recalculate the characteristic for the report by clicking on the Recomputestats button.
In the block called Monte Carlo, you can start the analysis of the system using the Monte Carlo method, which checks the EA for stability when certain settings are changed:
 Rice. 8. Graph of system indicators after analysis by the Monte Carlo method.
 This allows you to evaluate the system in conditions that are closer to reality. The algorithm can be used in two versions:
- - Swap deals randomly. This approach demonstrates the behavior of the system if the market were a little different. Such an analysis is carried out in order to assess the limits of the maximum drawdown;
- - with the probability parameter, you can set the skipping of a certain number of randomly selected deals. Imitation of a case when a trader missed them for one reason or another.
The methods can be used either singly or in combination. The window on the left will display a graph of possible scenarios. The closer the graph lines are to the main line, the more stable the system.
Interesting features of the program are implemented in the What if scenario? (What if the scenario?) - how would the profitability of the system change if its scenario changed. You can set the following exceptions:
- - trading only on certain days;
- - trade only during certain hours;
- - execution of transactions only for purchase or only for sale;
- - exclusion from the report of deals with maximum/minimum profit;
- - exclusion of transactions that are on the market at the same time;
- - do not take into account in the report transactions on account replenishment and withdrawal of funds, as well as transactions with a zero result;
- - use only every second deal in the report;
- - use a certain number of transactions during the day;
- - use a fixed lot (click to enlarge):
Perhaps, with some exceptions, the system will show greater efficiency and profitability.
The Equity control section displays a chart where you can monitor your equity level. Control is carried out on the basis of indicators plotted on the chart. The main purpose of this function is to improve system performance, reduce drawdowns:
 Rice. 10. Graph in the Equity control section.
 The Portfolio Analysis section provides the ability to analyze the correlation of transactions simultaneously from several reports loaded into the program. It also displays information about the number of deals opened simultaneously on several instruments.
If you understand programming, then the QuantEditor editor built into the program will be useful. You can program your own scenario in it, which can be used in the analysis in the Monte Carlo or What if scenario? . The editor opens up ample opportunities for better analysis of the trading system.
The EA Analyzer program will be useful for those traders who want to improve their strategy as much as possible and analyze their mistakes in order to achieve the best trading results.
For deep analysis of strategies and automated trading advisors based on reports from the MT4 platform.
We need to load the report into the analyzer, which we received by running our Expert Advisor in the MT4 Strategy Tester and saving it in the .htm format. The analyzer recognizes 4 different report formats, 2 of which are unique formats of StrategyQuant products and 2 formats of the MT4 platform - a report from the Strategy Tester (Strategy Report) and a report on your real transactions on the account (Account History).
Immediately after downloading, we get a complete analysis of the work of the adviser on history. Let's go through the main significant fields of the analyzer and find out what it gives us.

The first block of information gives us indicators describing the overall statistical picture (I will list the most significant indicators) - total profit (in $ and points), average annual profitability, number of transactions, profit factor, percentage of profitable transactions, drawdown (in $ and% of the balance), average profit indicators (per day, month, per trade).

The second block gives additional characteristics of trading, the indicators of stagnation are interesting here, which are absent in the standard MT4 report.

The third block shows us a trading report broken down by months and years.
The next block of analysis gives us a list of all completed transactions, which differs from the standard MT4 list in that it additionally gives information about the position holding time and the growing total result (in points, money, percentages).

The free margin chart block shows very interesting information - namely, the period of stagnation in days, the period during which the system was at a loss and drawdown. The chart can be displayed separately for short or long trades.

Extensive Trade Analysis block with 6 customizable histograms. A very interesting, in my opinion, block, now I will explain why. In this block, in any window, you can display 24 different histograms of statistics. The most important one is profit/loss broken down by hours and days of the week. Let's look at these charts.

On them, we observe that over 4 years of statistics, on average, we received a loss on Monday, Tuesday of the days of the week and transactions opened at 3.4, 6.7, 9, 10, 13, 19. Logically, we can conclude that the main the loss formed during trading in the Sydney session. Here we immediately go to the “What if scenario” block. We remove trading at night when the Australian market is open (we remember that our pair in question is AUDCAD) and run the “What happens if…” scenario.

As a result of script processing, we get an alternative version of the report.
If we click on it, it will activate and give us the same detailed analysis as the original version. But even at first glance, it is clear that if we introduce an additional trading filter for certain hours into our EA, then even though the number of transactions decreased by 40%, the profit increased by 29%, and the drawdown was almost halved. Let's activate the new report and go to the free equity chart.

From the initial 421 days of account stagnation, we have only 309.4 additional profitable months left. This option allows you not only to improve the adviser, but also can show you what hours or days of the week you should not trade with manual trading systems, you will see this if you download a report on your transactions from the MT4 terminal.
The settings block will allow you to get information about what would happen if you started trading with a different initial deposit than in the initial deposit report. You just need to enter the amount and click the "Recompute stat" button.

The next block is named after the Monte Carlo Principality, famous for its gambling business. Unfortunately, in the free version of the program, this block, according to its capabilities, is cut to the minimum size, which will only allow the user to get acquainted with it, but not to use it to its full potential.
The Monte Carlo method is a mathematical method for assessing the risk and stability of the system result. It evaluates the result that will be if there are deviations in your trading system. It allows you to understand whether the strategy is reliable, what profit / drawdown you can get, and whether it is worth trading this strategy at all. For example, your system gives 60% profitable trades with a 10% drawdown based on the backtest results, i.e. you know that you have 60% profitable trades for 40% losing trades, but you don’t know in what order they will come, the program rearranges the trades randomly and you can get a result where your drawdown will be 30%. Let's start the calculation on our example.

As a result of the calculation, in the left column we see that with a 95% probability we will get a lower return with a higher drawdown, but still acceptable for us, i.e. our system is stable. Of course, for a complete picture, we need to have the full version of the analyzer, because a small piece is not enough for reliable information.
Another commercial feature available only for review in the free version is called capital control. An article on the use of this function has not yet appeared on the official website, but most likely it makes it possible to calculate the effect of using the Moving Average (MA), Bollinger Bands (BB) or Ichimoku Kjun-Sen as a loss limiter, the periods of which can be selected immediately get results. In our case, using Ichimoku, we were able to reduce the system stagnation time from 401 days to 140 days, which is very cool. This means that if we enter a stop loss on this indicator into our Expert Advisor, we will get a significant improvement in our system.
The built-in tester of the MetaTrader4 terminal copes well with the functions assigned to it, but it has one significant drawback - the standard "states" obtained during the strategy optimization process contain a minimum of information. Get out of this position allows EA Analyzer software.
EA Analyzer is a full-fledged application (not an add-on to MT4) created by a foreign company, StrategyQuant.
I must say right away that it is useless to try to look for the official (and even free) version of this program, since several years ago the developers stopped supporting it (removed it from the site) and added a new paid Quant Analyzer product with similar functionality to their portfolio.
How to use EA Analyzer
Fortunately, the free demo version of EA Analyzer remained on the network, which we will use. It is installed in the same way as all other programs, ie. The first step is to download and run the distribution.
Then we accept the license agreement, select the installation path (preferably not on the system drive) and wait for the installer to unpack all the files.
The figure above shows the interface of this analytical platform. In principle, everything is clear here on an intuitive level using icons, but let's consider a specific example.
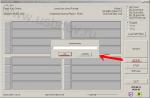
Suppose a trader has tested a robot in MetaTrader, i.e. received information in the following form.

The first step is to upload the “test” statement in htm format. To do this, go to the “report” tab and right-click anywhere in the information panel.

A context menu will appear, in which we select the "save as report" item. Next, through the standard Windows Explorer, save the "state" to a convenient folder on your hard drive or removable media. That's it, we don't need MetaTrader anymore.
Now we return to the EA Analyzer program and import the previously generated report into it. To do this, just click on the "Load" button and specify the path to the desired file.

And here the most interesting begins further. In fact, EA Analyzer imports from the statement only basic information on transactions (date, ticker, opening/closing prices) and the amount of the initial deposit, and the program recalculates all other indicators (mathematical expectation, profit factor, etc.).

What data do we get from EA Analyzer
The main tab "Overview" displays the most important information:
- The total number of transactions, incl. broken down by purchases and sales;
- Sharpe ratio, profit factor, profit to drawdown ratio, etc.;
- Average monthly profit and trade expectation;
- In addition, EA Analyzer compiles financial results from operations separately for each month.

The last point is especially important, since MetaTrader4 does not provide such detailed information. Or rather, it can only be obtained manually by moving the mouse cursor over and remembering the key numbers in your mind (with what amount the month was opened).

The next tab of the EA Analyzer (List of traders) lists the trades. Basically, there is nothing interesting here.

Things are quite different with the Equity Chart field, because here we see how the funds and drawdown changed.

By default, the chart shows the cumulative net result of buying and selling, while there is no detailed information about the drawdown (instead, the area of the longest stagnation, within which the account could not overcome its last High, is highlighted in pink).
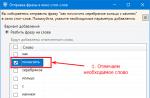
To enable graphical display of drawdown, you need to go to the Drawdown section and select the most appropriate option instead of “Don’t show” - in money (in money), percentages (in %) or points (in pips).

But that's not all. Here, EA Analyzer allows you to display equity separately for buys and sells.


As you can see, here the user displays various statistical calculations and indicators that clearly demonstrate the strengths and weaknesses of the strategy. Let's briefly list them:
- Trades by duration - distribution of trades by holding time;
- Trades by hour, weekday, day, etc. - the total number of transactions opened or closed at one hour of the day, day of the week, day of the month, etc.;
- P/L by hour, weekday, day, etc. - total net profit or net loss received per hour of the day, day of the week, day of the month, etc.
Before going any further, I would like to dwell on the last point. With its help, EA Analyzer allows you to increase the effectiveness of the tested strategy, for example, if there is a large net loss on certain days of the month, it is reasonable to simply not trade during such periods (perhaps at this time the ministries publish a pool of important statistics, which leads to unprofitable operations).

- P/L by trades duration is another important EA Analyzer chart showing how holding time affects position performance. With its help, I optimize working timeframes;
- Long vs short trades - the ratio of buys and sells (displayed as a circular histogram);
- Long vs short P/L - total profits on short and long positions (in a good Forex system they should be approximately the same);
- Profit/loss - the ratio of profitable and unprofitable operations
- Long profit/loss and short profit/loss - the same, only in the context of purchases and sales;
- Wins/losses by hour, day, etc. - the ratio of profitable and unprofitable operations by hours, days of the week, etc.;
- Wins/losses profit by hour, day, etc. - the ratio of total profit and total loss on transactions opened/closed at one hour of the day, day of the week, etc.
The remaining fields of the EA Analyzer tester
As for the rest of the EA Analyzer fields, only two tabs can be useful among them - “What if scenario” and “Portfolio analysis”.
The “What if scenario” section allows you to simulate the equity dynamics that will result if some deals are excluded from the selection. In my example, the largest net loss is generated by trades opened at 9 am and from 13:00 to 13:59, in other words, EA Analyzer recommends that I refuse such operations. Let's take the advice into account.

As a result, the total profit increased, but the drawdown also became larger than before. I hope the meaning of this function is clear - we set different conditions and see how they affect the effectiveness of the strategy.
And the last section "Portfolio analysis" will be especially useful for portfolio managers, as it allows you to evaluate the correlation between different strategies. Of course, before working with it, you need to download several different states and form a portfolio out of them.

The result of the analysis will be presented in the form of a correlation matrix, which immediately shows how similar the systems are (if the equity of different strategies change synchronously, it makes sense to leave only one of them in the portfolio, why scatter attention?)

The remaining functions of EA Analyzer (for example, the Monte Carlo method) remained paid, but my experience shows that the free functionality is more than enough for full-fledged research.