Keywords:
- table of type "objects-properties"
- object-object-one table
- calculation table
- one-to-one correspondence
Table design rules
To describe a number of objects that have the same sets of properties, tables are most often used.
You are well aware of the tabular presentation of the lesson schedule; the schedules of buses, planes, trains and much more are presented in tabular form.
The information presented in the table is clear, compact and easy to see.
The table may contain information about various properties of objects, about objects of the same class and different classes, about individual objects and groups of objects.
The following rules for formatting tables must be observed.
- The title of the table should give an idea of the information contained in it.
- Column and row headings should be short, not contain unnecessary words and, if possible, abbreviations.
- For numerical values, the table must indicate units of measurement. If they are common to the entire table, then they are indicated in the table title (either in parentheses or separated by a comma after the title). If the units of measurement differ, they are indicated in the headings of the corresponding rows or columns.
- It is advisable that all table cells be filled in. If necessary, the following symbols are entered in them:
- ? - data unknown;
x - data is impossible;
↓ - data must be taken from the overlying cell.
In order to create a tabular model based on the information presented in text form, you must:
- highlight the names of objects, the names of object properties and the values of object properties in the text;
- clarify the table structure;
- Fill out the table by transferring information from the text into it.
When highlighting object names, property names and their values in the text, it is convenient to underline them with different lines. Let's agree to underline object names with a straight line, property names with a double underline, and property values with a dotted line.
For example:
The capital of France is Paris.
The depth of the lake is 3 m.
The girl's name is Masha.
Each of the properties considered in these examples (“capital”, “depth”, “name”) characterizes only one object. We will call such properties single.
Very often, a property characterizes a couple of objects at once. We will agree to emphasize this paired property with a triple line.
For example:
The distance from Moscow to Cheboksary is 600 km.
Vova has a “four” grade in history..
Table of type "objects-properties" (OS)
A table of the “objects-properties” type is a table containing information about the properties of individual objects belonging to the same class (Fig. 32).
Rice. 32
The number of rows in the table depends on the number of objects present, and the number of columns depends on the number of properties being considered.
Example 1
Table 3.
Cities of the Golden Ring of Russia

Table 3 provides information about some ancient Russian cities that preserve unique monuments of our culture and history and form the world-famous Golden Ring of Russia. This information is reflected in the table header.
The table shows the objects “Vladimir”, “Kostroma”, “Pereslavl-Zalvesky” and “Gus-Khrustalny”, belonging to the “city” class. For each object, the values of the properties “year of foundation”, “founder” and “landmark” are given, expressed in numbers and words.
In small tables (3-4 rows), objects can be listed in any order. If there are a lot of objects in the table, then they need to be arranged in some meaningful order, according to some rule. For example, in Table 3, cities might be listed: in alphabetical order by ascending or descending year of their founding.
If a table of the OS type has more properties than objects, then it can be “turned on its side” - the rows can be turned into columns, and the columns into rows.
What exactly to place in the row headers and column headers - objects or properties - depends on the specific table. As a rule, a table with many rows and few columns is more convenient than a table with few rows but many columns.
Objects-Objects-One (OOO) table
An objects-objects-one table is a table containing information about some single property of pairs of objects, most often belonging to different classes.
The general view of LLC type tables is shown in Fig. 33.

Rice. 33
In this table, the column headings have a complex (two-tier) structure.
Example 2
Table 4

An LLC type table can be “turned on its side” - the rows are turned into columns, and the columns into rows (Table 5).
Table 5
Computer science grades for 6th grade students

An OOO type table records one property of a pair of objects, so its cells always contain values of the same type: either numbers, or words, or graphic images.
Example 3
The table “Distances between cities” presents the distances between pairs of objects belonging to the same class “city”, therefore objects of this class are included in both rows and columns of the table. As a result, the table head “loses” one level, and the table itself looks simpler (Table 6). This table also applies to the LLC type.
Table 6

Similar tables are available in road atlases. True, there they are formalized like this (Table 7).
Table 7
Distances between cities (km)

Example 4
Table 8
Hobbies of 6th grade students

From Table 8 you can get an idea of what 6th grade students are interested in, what clubs and sections they attend. If a student is interested in dancing, sports or computer graphics (attends the corresponding club or section), then a 1 is put in the cell, and if not - 0.
An important feature of this table is that it records not quantitative (how many?), but qualitative properties (the presence or absence of a connection between objects).
Calculation tables
Computing we will call such tables in which the values of some properties are calculated using the values of other properties from the same table.
Example 5
Table 9
Gift set for a first grader

This table is specific to OS type. The values in the “Cost” column are calculated using the formula: price x quantity.
We will call the last row of this table the final row. It is intended for recording results. The total row has the heading "Total:" or "Total:".
The total row cells contain the sums of numbers from the corresponding columns. But these amounts must make sense. So, if we add up all the numbers in the “Quantity” column, we will know the total number of items included in the gift set. The total cost of the set is found by summing all the numbers in the “Cost” column. But the amount in the “Price” column does not make any sense.
Example 6
Getting ready to go to the beach, the cheerful little people decided to stock up on soft drinks. Dunno took with him 2 liters of kvass, 1 liter of soda and 1 liter of raspberry syrup, Donut - 3 liters of soda and 2 liters of raspberry syrup, Toropyzhka - 2 liters of soda, Doctor Pilyulkin - 1 liter of kvass and 1 liter of castor oil. How many liters of each type of drink did all the little men take together? How many liters of drinks did each of the men take with them? How many liters of drinks did all the little men take together?
Let's present the available information about pairs of objects of the classes “person” - “drink” in a table of the LLC type. In this case, the property of a pair of objects will be the amount (in liters) of the drink stored by the man.
Table 10

The answer to the first question is in the summary column of the table (it has the heading “Total”). The answer to the second question is in the bottom line. The answer to the third question is in the lower right cell - at the intersection of the total row and the total column.
Note that the last number can be obtained in two ways. You can find out how many drinks the little men took with them if you add up the number of drinks taken by Dunno, Donchik, Toropyzhka and Pilyulkin (summing up on the final line). The same number will be obtained if you add up the amount of kvass, soda, raspberry syrup and castor oil taken by the little men (summing over the final column). This feature of the number in the lower right cell of the table can be used to control your calculations.
Solving logical problems using multiple tables
Objects of two classes can be in a one-to-one correspondence relationship. It means that:
- these sets have the same number of objects;
- each object of the first set is connected by a given property with only one object of the second set;
- each object of the second set is connected by a given property with only one object of the first set.
In the corresponding LLC type table, each row and each column will contain only one 1, indicating the presence of a relationship between objects. This property can be used when solving logical problems.
Example 7
Masha, Olya, Lena and Valya are wonderful girls. Each of them plays a musical instrument and speaks one of the foreign languages. Their tools and languages are different. Masha plays the piano. A girl who speaks French plays the violin. Olya plays the cello. Masha does not know Italian, and Olya does not speak English. Lena doesn't play the harp, and the cellist doesn't speak Italian. It is necessary to determine what instrument each girl plays and what foreign language she speaks.
The problem considers objects of the classes “girl” (objects with the names “Masha”, “Olya”, “Lena” and “Valya”), “musical instrument” (“grand piano”, “violin”, “cello”, “harp”) and “foreign language” (“French”, “German”, “English”, “Italian”). Pairs are formed from objects of the classes “girl” - “musical instrument”, “girl” - “foreign language”, “musical instrument” - “foreign language”, and there is a one-to-one correspondence between the objects of these classes (Fig. 34).

Rice. 34
The problem statement explicitly indicates the presence or absence of a connection between some objects of the classes under consideration.
You can build two separate tables of type 000 for the pairs “girl - musical instrument” and “girl - foreign language”. It is more convenient to combine them into one table (Table 11). The presence of the property in a pair of objects “a girl plays a musical instrument” (“the girl speaks a foreign language”) will be denoted by 1, and its absence by 0.
In this example, it is convenient to first fill out the top part of the table based on the information that there is a one-to-one correspondence between the set of girls and the set of musical instruments, and also that:
Masha plays the piano;
Olya plays the cello;
Lena doesn't play the harp.
Table 11

Now, taking into account the connections recorded in the first part of the table, let’s proceed to filling out its second part, using the data from the problem statement:
A girl who speaks French plays the violin.
Masha does not know Italian, and Olya does not speak English.
The cellist doesn't speak Italian.
Table 12

Thus, Masha’s hobbies are piano and English, Olya’s are cello and German, Lena’s are violin and French, Valya’s are harp and Italian.
Roll call of students and finding out the reasons for the absence of students.
knowledge, practical skills.
Main questions of the topic: - 45 min
Using the MSExcel analysis package for statistical calculations.
Determination of basic statistical indicators.
Determining the reliability of differences in the arithmetic means of two samples.
a) dependent (pairwise related) sample populations;
b) independent sample populations.
Correlation analysis.
Regression analysis.
Break -10 min
Research method
Independent work of students - 50 min
Tasks:
|
Practical skills |
Evaluation criterion |
|
|
Launch Microsoft Excel 2007 | ||
|
Insert table No. 1 into spreadsheets on sheet 1 " Table of birth and death rates honey . Statistical Office " and fill it out (as indicated in table No. 1). | ||
|
Calculate Variance, Correlation Coefficient | ||
|
Interpret the result obtained (define the parameters: dispersion, correlation coefficient). | ||
|
Insert table No. 2 into spreadsheets on sheet 2 " Content Hb in blood" and fill it out (as indicated in table No. 2). | ||
|
Determine the main statistical indicators of patients (use the analysis tool Descriptive Statistics) | ||
|
Interpret the result obtained (define the parameters: mean, standard error, median, etc.) | ||
|
Insert table No. 3 into spreadsheets on sheet 3 " The body's reaction to the introduction of acetophos» and fill it out (as indicated in table No. 3). | ||
|
In this example, we select a Two-sample test with different variances, because There is a different number of observations: for men 5, for women – 4. | ||
|
Interpretation of results. Mean cholinesterase values ( 83% for men And 61% for women) are quite different and the null hypothesis that there is no difference between the groups (i.e., the sample means are equal to each other) is rejected. This follows from the fact that the probability of the null hypothesis being realized is small ( p=0.014, which is less than the significance level of 0.05) and the probability of random occurrence of the analyzed samples ( P(T<= t) two-way) is less than the significance level (p=0.05) and the calculated value t-statistics more than t-critical two-way(tabular), we can assume that the differences between the samples are not random, i.e. the differences are significant. Conclusion. The female body is more sensitive to the action of acetophos than the male body with a significance level of p<0.05. Where did this data (in bold) come from? | ||
|
Insert table No. 4 into spreadsheets on sheet 4 " Heart rate in men and women» and fill it out (as indicated in table No. 4). | ||
|
Explain the reason for choosing samples (dependent or independent) | ||
|
In this example, we choose a Two-sample t-test with equal variances, because the number of observations in the samples are the same | ||
|
Conclusion. There are no significant differences between the heart rates of men and women, because p=0.346, which is more than 0.05 and the calculated value of the t-criterion (-0.988) is less than the t-critical two-sided one (2.228). Where did this data come from? | ||
|
Insert table No. 5 into spreadsheets on sheet 5 " Heart rate in men and women before and after exercise» and fill it out (as indicated in table No. 5). | ||
|
Explain the reason for choosing samples (dependent or independent) | ||
|
In the example, we choose the Paired two-sample t-test for means, because The study was conducted within the same population. | ||
|
Conclusion. A significant increase in heart rate after physical activity was revealed, because p=0.000... much less than 0.05 and the calculated value of the t-criterion (-11.406) is greater than the two-sided t-critical (2.201) (the minus sign is not taken into account. Where did this data come from? | ||
|
Total: |
Application:
Table No. 1
|
Birth and death table honey . Statistical Office |
||
|
Years |
Fertility |
Mortality |
|
dispersion | ||
|
correlation coefficient | ||
Table No. 2
Task No. 3
The reaction of the human body to the introduction of acetophos was studied. Blood cholinesterase activity was measured in men and women 2 hours after a single administration of acetos at a dose of 2 mg/kg body weight (as a percentage of the initial background). Is it possible to draw a conclusion from these data that the female body is more sensitive to the action of acetophos?
Table No. 3
|
The body's reaction to the introduction of acetophos |
||
Task No. 4
It is necessary to check whether the differences in heart rates between men and women are significant in the case under consideration.
Table No. 4
|
Heart rate (HR) in men and women |
|||||
Task No. 5
It is necessary to check whether the differences in the heart rate of men and women before and after (HRHR) physical activity are significant in the case under consideration.
Table No. 5
|
Heart rate (HR) in men and women before and after (HR) physical activity |
|||||||
Literature:
E.N. Ivanova. Microsoft Office Word 2007. As simple as two and two. M.: Eksmo, 2007. 256 p.
A.P. Sergeev. Self-instruction manual Microsoft Office 2007. M.: Publishing house. House "Williams", 2007. 432 p.
Microsoft Office 2007 for dummies. Per. from English M.: LLC “I.D. Williams", 2007. – 368 p.
Break -10 min
After completing the practical part of the work, the teacher checks the correctness and sequence of the students’ actions to see if they have achieved the final result. Then the teacher conducts a survey of students analyzing the topic. Finds out its practical application.
Control of the final level of knowledge - 20 min
The teacher analyzes the results of students’ practical work and finds out whether they completed the work consciously. Then the teacher conducts a survey of students analyzing the topic.
Control
Questions:
What is the analysis package used for?
How to determine the reliability of the difference between the arithmetic means of two:
a) dependent; b) independent samples?
What Excel statistical functions are used in regression analysis?
Tests: See Collection of test tasks in “Computer Science”, topic “MSExcel-2”
General knowledge assessment - 5 min
Subject№ 7 . Database. Creation of individual medical records using databasessdata
Target: Formation of practical skills in creating tables, entering data into table cells, editing data, sorting data, selecting data using a filter, types of relationships between tables and how to set them up.
Learning Objectives: Familiarization with the general principles of creating tables using the designer, wizard and by entering data, entering and editing data, filtering. Formation of skills for creating database structures and diagrams,
establishing types of relationships between tables, methods for installing and deleting relationships.
Number of formedcompetencies: Practical skills.
Main questions of the topic: - 45 min
Creation of a database (DB).
Creating tables.
Working with tables (searching and replacing data, filters, sorting).
Relationship between tables.
Data schema.
Establishing and removing relationships between tables.
Break -10 min
Teaching and learning methods: project method.
Methods for monitoring the competencies formed during the lesson:
checking the results of practical work on a PC (the student must complete an individual task to gain certain skills in solving standard problems);
Mastering practical skills: Solving typical and situational problems.
Tasks:
|
Practical skills |
Evaluation criterion |
|
|
In the C:\STUDENT folder, create a folder under your group number. In the folder under your group number, create a database file “Dean’s Office”. | ||
|
Create the “Students” table in design mode, i.e. create a table by defining field names, data types, and field properties: do not specify a key field.(Table No. 1) | ||
|
Fill in the table “Students” (Table No. 2) | ||
|
complete table No. 2 in design mode: add a new field to table No. 2 "Phone number" and define the data type as "numerical"; add new records to the table; | ||
|
rename the field name "Place of Birth" on "Address"; | ||
|
change the field format "Payment for studies" With "Euro" on "basic". | ||
|
Create a “Disciplines” table in design mode, i.e. create a table by defining field names, data types and field properties: (Table No. 3) | ||
|
Complete the table “Disciplines” (Table No. 4) | ||
|
Create inter-table relationships. Open the WORKING WITH DATABASES tab. In the SHOW OR HIDE group, click on the DATA SCHEME icon - the DATA SCHEME window will open. Click on the DISPLAY TABLE icon to open the ADD TABLE window and select the “Students” and “Disciplines” tables . Note. If the default tables are already selected in the DATA SCHEME window, then you need to add only the missing table from the ADDING TABLE window. Select discipline codes in the “Students” table. Drag this field to the Discipline code field of the “Disciplines” table. When you release the mouse button, a dialog box will automatically open Changing connections. Click the button Create in the dialog box Changing connections. In the data diagram window, examine the resulting connection | ||
|
Note. Don't check the box Ensuring data integrity: This is not required in this exercise, but it may interfere with the implementation of educational experiments with tables. |
||
|
When closing the window Data Schema save changes. |
||
|
Filter and sort the data using the created tables. |
Table No. 1
|
Field name |
Data types |
Are common (Field size) |
|
Discipline code |
Numerical |
Long integer |
|
Student's name |
Text | |
|
Logical | ||
|
Date of Birth |
Date Time |
Short format |
|
Place of Birth |
Text | |
|
Numerical | ||
|
Name of discipline |
Text | |
|
Text | ||
|
Payment for studies |
Monetary |
Table No. 2 "Students»
|
Code discipline lines |
Student's name |
Date of Birth |
Place of Birth |
Group |
Name of discipline |
Grade |
Payment for studies |
|
|
Askarova G. |
Computer science | |||||||
|
Meiramov N. | ||||||||
|
Sadykova N. |
Mathematics | |||||||
|
Bolatova G. |
Karaganda |
Computer science | ||||||
|
Amirov K. |
Pavlodar | |||||||
|
Nasyrova Sh. |
Biostatistics | |||||||
|
Kusainova G. |
Mathematics | |||||||
|
Duysenov Zh. |
Biostatistics | |||||||
|
Karaganda |
Computer science |
Table No. 3
Table No. 4 "Disciplines»
|
Discipline code |
Name of discipline |
Type of control |
Number of hours |
Grade |
|
Computer science | ||||
|
Mathematics |
Oral survey | |||
|
Written form | ||||
|
Biostatistics |
Test/Oral Questioning |
Literature:
1. Sergeev A.P. Self-instruction manual. - Microsoft Office 2007. M.: St. Petersburg. Kyiv, 2007, pp. 432.
Break -10 min
Collaborative work between student and teacher - 25 min
Control
Questions:
What is a DBMS? What is the purpose of this type of software?
What are the main functions of a DBMS?
What type of DBMS is Access?
What is a database and how to create a new database?
What data storage structure is used in the database?
Which DBMS are called relational?
What are the features of a relational database and how is the data structure described in it?
What is the convenience of tabular presentation of information?
What is a record, a record field? What information do they contain?
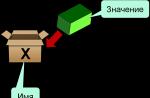
Define the following concepts: field name, field value, field type. What are the field types?
What is a table in an Access database and what does it contain?
How to edit data in the database: add (delete) a field, add (delete) a record, add a new record in the middle of the table.
How does the field order and field name change?
How are field properties edited and how to set a new key field?
What steps do you need to take to find data?
Give the concept of a key.
What types of connections between objects do you know?
Which table is considered the main table and which is the subordinate table of the relationship?
How do you search by field value?
How is data sorted?
What is a filter for and how is a simple filter created?
How to filter data by multiple values?
Tests: See Collection of test tasks in “Informatics”, topic “Application software: Working with databases. (MSAccess1)"
General assessment of knowledge- 5 minutes
The teacher analyzes competencies on this topic: knowledge, practical skills and analyzes common mistakes made by students when completing assignments. Then the teacher analyzes the student’s achievements and shortcomings and assigns a final grade to the journal according to one parameter (for practical skills).
Subject№ 8 . Database. Working with individual medical records
Target: Learn how to create and edit relational-type databases, perform queries against them (selection queries, queries with parameters, cross-queries, etc.), formatting complex reports and forms.
Learning Objectives: Formation of skills to develop custom forms for data entry into single-table and relational databases, data schemas, create queries for searching and selecting data, use various query methods, use formulas and functions in arithmetic expressions, create reports for data output.
Organizational part - 5 min
Roll call of students and finding out the reasons for the absence of students, who is not ready for class, checking notes.
Number of competencies being formed: knowledge, practical skills.
Main questions of the topic:- 45 min
Creating queries in design mode.
Types of requests.
Create complex forms and reports using a wizard.
Break -10 min
Teaching and learning methods: chain method.
Methods for monitoring the competencies formed during the lesson:
testing is carried out in computer form (the student must answer a “test” containing minimal knowledge and skills - basic definitions, theoretical questions of this topic);
checking the results of practical work on a PC (the student must complete an individual task to gain certain skills in solving standard problems);
Independent work of students - 50 min
Mastering practical skills: Solving typical and situational problems.
Tasks:
|
Practical skills |
Evaluation criterion |
|
|
Create a selection request. | ||
|
Create a request for a sample of students from all groups. The resulting table must also contain the student's full name. To do this, follow these steps: Launch MSAccess. Open the "Dean's Office" file. Click on the “Office” button - select the “Open” command - click on the database name “Dean’s Office” in the folder C:\STUDENT\ YOUR GROUP NUMBER. | ||
|
In the "Dean's Office" window : database open the CREATE tab. In the OTHERS group, click on the REQUEST CONSTRUCTOR icon - a sample request form will open. At the same time, a dialog box will open Adding a table. In the window Adding a table select the “Students” table and click on the “Add” button. Close the window Adding a table. | ||
|
In the list of fields in the “Students” table, select the fields included in the resulting table: Discipline Code, Student Name, Group. Make your selection by double clicking on the field names. Complete the request form using the sample. When closing the request, enter its name - “Group”. To run the created query, in the NAVIGATION AREA, double-click the Group query icon. | ||
|
Create a selection requeststudents from« Astana" orfrom « Almaty» | ||
|
based on the “Students” table, select the fields included in the resulting table: student’s full name, place of birth and group. | ||
|
Set selection conditions for the Birthplace field. In line selection condition enter “Astana or Almaty”. Only students from Astana or Almaty will be selected from the table. Note.Try itin lineselection condition enterNot Astana | ||
|
Complete the request form using the sample. When closing the request, enter its name - “Place of birth”, run the created request. | ||
|
Create a selection request: information about studentsexcept « Bolatova G.» | ||
|
based on the “Students” table, select the fields included in the resulting table: student’s full name, group, date of birth and place of birth. | ||
|
selection condition enter “NotBolatova G.” All students except “Bolatova G.” will be selected from the table. | ||
|
Complete the request form using the sample. When closing the request, enter its name - “Except Bolatova”, run the created request. | ||
|
Create a selection requeststudents whose tuition fees are less than 550000 | ||
|
based on the “Students” table, select the fields included in the resulting table: student’s full name, tuition fees. | ||
|
Set selection conditions for the Tuition Payment field. In line selection condition enter<550000. Из таблицы будут выбираться толькоте студенты которые оплачивают меньше550000. | ||
|
Complete the request form using the sample. When closing the request, enter its name - “Payment”, run the created request. | ||
|
Create a request "cparameter". | ||
|
Based on the “Students” table, select the fields included in the resulting table: student’s full name, Group, Place of birth, Tuition fee. | ||
|
Set selection conditions for the student's full name field. In line selection condition enter [Enter student's last name]. When running the query, the user will be prompted to enter the required value. | ||
|
Complete the request form using the sample. When closing the request, enter its name - “Students”, run the created request. | ||
|
Createcrossrequest. | ||
|
based on the “Students” table, select the fields “Student’s name”, “Name of discipline” “Grade”, from the table “Disciplines” select the field “Type of control” . | ||
|
Complete the request form using the sample. When closing the request, enter its name - “Cross Request”, run the created request. | ||
|
Create a query “with calculation”. | ||
|
based on the “Students” table, select the fields included in the resulting table: student’s full name, tuition fees. | ||
|
Enter a new field - Course: [Salary]/147 in the “field” line of the request form according to the sample. Complete the request form using the sample. When closing the request, enter its name - “Dollar”. | ||
|
Create summary query | ||
|
In the sample request form, enter the following fields: “Student’s name”, “Group”, “Name of discipline”, and “Payment for studies” from the table “Students” and “Grade” from the table “Disciplines” . | ||
|
For the field " Full namestudent» enter sorting in ascending order. From the SHOW OR HIDE group of the CONSTRUCTOR tab (Working with queries), click on the RESULTS icon. This command is necessary to create a line at the bottom of the form Group operations. It is on its basis that group operations are created (meaning Grouping). For other fields, click in this row (Grouping) - a drop-down list button will appear from which you can select the resulting function to calculate the value in this field. For the “Group” field, select the final function first. For the field “Payment for studies”, select the final function MAX. | ||
|
Complete the request form using the sample. When closing the request, enter its name - “Total”, run the created request. | ||
|
Create forms using the FORM WIZARD | ||
|
Based on the “Students” table, create a form of the “One Column” or “Tabular” type | ||
|
based on the “Disciplines” table, create a form of the “Ribbon” or “Aligned” type | ||
|
Createreports using the REPORT WIZARD | ||
|
Based on the “Students” table, create a “Column” and “Tabular” report | ||
|
based on the “Disciplines” table, create a report of the “Aligned” type |
Literature:
1. Sergeev A.P. Self-instruction manual. -MicrosoftOffice2007. M.: St. Petersburg. Kyiv, 2007, pp. 432.
2. V.Ya. Gelman. Medical informatics. Peter. 2001 145-186 pp.
3. J. Courter, A. Markvi.MSOffice2000.Moscow. 2001 357-428 pp.
4. Vitaly Gerasevich. Computer for a doctor. Saint Petersburg. 2002 229-253 pp.
5. S. Simonovich. “Informatics.” Basic course." 2nd edition. S.-P., 2003, 340-367 pp.
Break -10 min
Collaborative work between student and teacher - 25 min
After completing the practical part of the work, the teacher checks the correctness and sequence of the students’ actions to see if they have achieved the final result. Then the teacher conducts a survey of students analyzing the topic. Finds out its practical application.
Control of the final level of knowledge - 20 min
The teacher analyzes the results of students’ practical work and finds out whether they completed the work consciously. Then students take tests to control their knowledge.
Control
Questions:
What is a request?
What types of requests do you know?
What is the difference between filtering and querying?
What types of queries are used?
How is a select request created?
Is it possible to specify conditions when creating a request?
What is the form?
List the types of data form.
What are the forms for?
What is an autoform?
How to create a form using the Wizard?
How can I change an existing form?
How do you change the properties of form fields?
What is a report?
Name the report wizard.
Tests: See Collection of test tasks in Computer Science, topic “Creating queries, forms and reports (MSAccess2)”
- General knowledge assessment - 5 min
The teacher analyzes competencies: knowledge, practical skills on this topic, and analyzes common mistakes made by students when completing assignments. Then the teacher analyzes the student’s achievements and shortcomings and assigns a final grade to the journal according to two parameters (for knowledge and practical skills).
Topic No. 9.Network technologies.Working with andinternet- technologies
Target: Study the basics of computer networks, help students understand the basic concepts and principles of creating computer networks, teach how to search for information. Formation of skills in creating an HTML document, inserting graphic objects into an HTML document, and instilling in students practical skills in developing Web pages.
Learning Objectives: Formation of concepts about networks, prerequisites and the need for network interaction between computers, hardware and software, global and local networks, network topology and methods of data transmission, basic technologies, protocols and standards of local networks.
Formation of skills in creating an HTML document, inserting graphic objects into an HTML document.
Information is information received from the world around us. Based on the form of presentation, they distinguish between numerical, text, graphic, audio, text and video information. A tabular form is also a convenient form for presenting information. When asked what is the convenience of tabular presentation of information, we can safely answer that in this form everything is compactly organized and there is no unnecessary text, so you can quickly find the necessary values.
A table for presenting information is characterized by its name, the content of cells, the number of rows and columns with their names. The main elements of a table view are records - these are rows that contain data of various types and most often refer to one object; fields are columns that typically contain the same type of data; details are specific values that are located in the cells of the table being presented.
In order to bring information to a tabular presentation, you need to analyze all the information and determine the objects that the presentation will be about, highlight their properties and relationships with each other. Next, determine the total number of required columns and the order of their arrangement, assign names for these columns and select the order of placement of rows as well as assigning names. After which you can place details or data in table cells.
1. What are the advantages and disadvantages of tabular presentation of databases?2. What are the advantages and disadvantages of representing databases withusing the form?3. What is a record and what is a field in a database?4. What types of fields can be present in the database?5. Is there a difference between a database and a DBMS? 6. What applications can perform the functions of a simple DBMS?
Please help me with my computer science test! This is urgent! I give 30 points!1. An example of a documentary database is a database containing:
a)legislative acts
b) Information about the personnel of the institution
c) Information about the financial condition of the institution
2. A database is...
a) Class magazine page
b) Directory of files stored on disk
c) Train schedule
d)Spreadsheet
b) Vector
c) Family tree
d) Two-dimensional table
b) Automatically numbered
c) They are named according to rules specific to each specific DBMS
d) Numbered according to rules specific to each specific DBMS
a) One of the fields
b) One entry
c) Several entries
d) All entries
a) Heterogeneous information (data of different types)
b) Extremely homogeneous information (data of only one type)
8. Expression value 0.7-3>
a) Numerical
b) Logical
c) String
d) Whole
9. Database management system (DBMS) is...
10. The model reflects:
e) All essential features
a) Text
b) Mathematical
c) Structural
d) Tabular
e) Graphic
c) Modeling subject; modeling goals and modeled object
13. Drawings, maps, drawings, diagrams, diagrams, graphs are models of the following type:
a) Tabular information
b) Mathematical models
c) Full-scale
1. An example of a documentary database is a database containing:
a) legislative acts
b) Information about the personnel of the institution
c) Information about the financial condition of the institution
2. A database is...
3.An example of a hierarchical database is
a) Class magazine page
b) Directory of files stored on disk
c) Train schedule
d) Spreadsheet
4.The most accurate analogue of a relational database can be:
a) Unordered set of data
b) Vector
c) Family tree
d) Two-dimensional table
5. Relational database fields
a) Named arbitrarily by the user with certain restrictions
b) Automatically numbered
c) They are named according to rules specific to each specific DBMS
d) Numbered according to rules specific to each specific DBMS
6.The structure of the relational database changes when deleted:
a) One of the fields
b) One entry
c) Several entries
d) All entries
7.A relational database record may contain:
a) Heterogeneous information (data of different types)
b) Extremely homogeneous information (data of only one type)
c) Text information only
d) Purely numerical information
8. The value of the expression 0.7-3>2 refers to the following data type:
a) Numerical
b) Logical
c) String
d) Whole
9. A database management system (DBMS) is...
10. The model reflects:
a) All existing features of the object
b) Some of all existing ones
c) Essential features in accordance with the purpose of modeling
d) Some essential features of the object
e) All essential features
11. When describing the relationships between system elements, it is most convenient to use the following type of information model:
a) Text
b) Mathematical
c) Structural
d) Tabular
e) Graphic
12. The concept of a model makes sense if there is:
a) Modeling subject and modeled object
b) Goals of modeling and the modeled object
c) Modeling subject; goals of modeling and the modeled object
d) Goals of modeling and two different objects
e) Desires to preserve information about an object
13. Drawings, maps, drawings, diagrams, diagrams, graphs are models of the following type:
a) Tabular information
b) Mathematical models
c) Full-scale
d) Graphic information
e) Hierarchical information
14. The essence of the main thesis of formalization is the fundamental possibility:
a) Presentation of information on a tangible medium
b) Transfer of information from one object to another
c) Human information processing
d) Storing information in computer memory
e) Separation of an object and its designation